Content from Getting Started with Tableau Public
Last updated on 2025-06-05 | Edit this page
Overview
Questions
- What is Tableau?
- What is Tableau Public?
- How do I install Tableau Public and open a dataset?
- What kinds of data can Tableau help me visualize?
Objectives
- Understand what Tableau is and the difference between the Public and Desktop versions.
- Install and launch Tableau Public.
- Load a sample dataset and become familiar with the interface.
What is Tableau?
Tableau is a data visualization platform that enables users to explore and communicate data effectively through interactive charts, dashboards, and maps. It’s widely used across many fields, including business, public policy, and research.
Tableau Public vs. Tableau Desktop
There are two main versions of Tableau:
- Tableau Public is a free version that lets you create visualizations and publish them to a public web profile. It’s ideal for learning, sharing, and non-sensitive data.
- Tableau Desktop is the full version available through paid licenses or free academic access for students. It includes additional features like saving locally and connecting to a broader range of data sources.
Feature Comparison Table for current Tableau Public and Desktop
| Feature | Tableau Desktop | Tableau Public (Desktop & Web) |
|---|---|---|
| Save Locally | Yes | Yes (as of 2025.1.2) |
| Private Workbooks | Yes (local, Server, Cloud) | No (primarily for public sharing; local saves are for personal use/prep for publish) |
| Data Sources | Full (databases, cloud, files, etc.) | Limited (CSV, Excel, Google Sheets, JSON, PDF, Spatial Files, WDC, etc.) |
| Live Connections | Yes | No (works with data extracts/snapshots) |
| Geospatial Files | Yes | Yes |
| Join/Blend Data | Yes (full capabilities) | Yes (for supported file types; limited cross-database/published source joins) |
| Export Options | PDF, PPT, Image, Data, Crosstab, etc. | Image, PDF, Data (when viewed on web); limited image export from desktop app only |
| Cost | Paid license (free for students) | Free |
Launching Tableau and Connecting to Data
To get started, if Tableau Desktop (or Public) is in your dock, you can click it open. However, a standard method is to navigate to your Applications folder (or wherever you installed it) and launch it from there.
Once Tableau is open:
- Under Connect, click Text File.
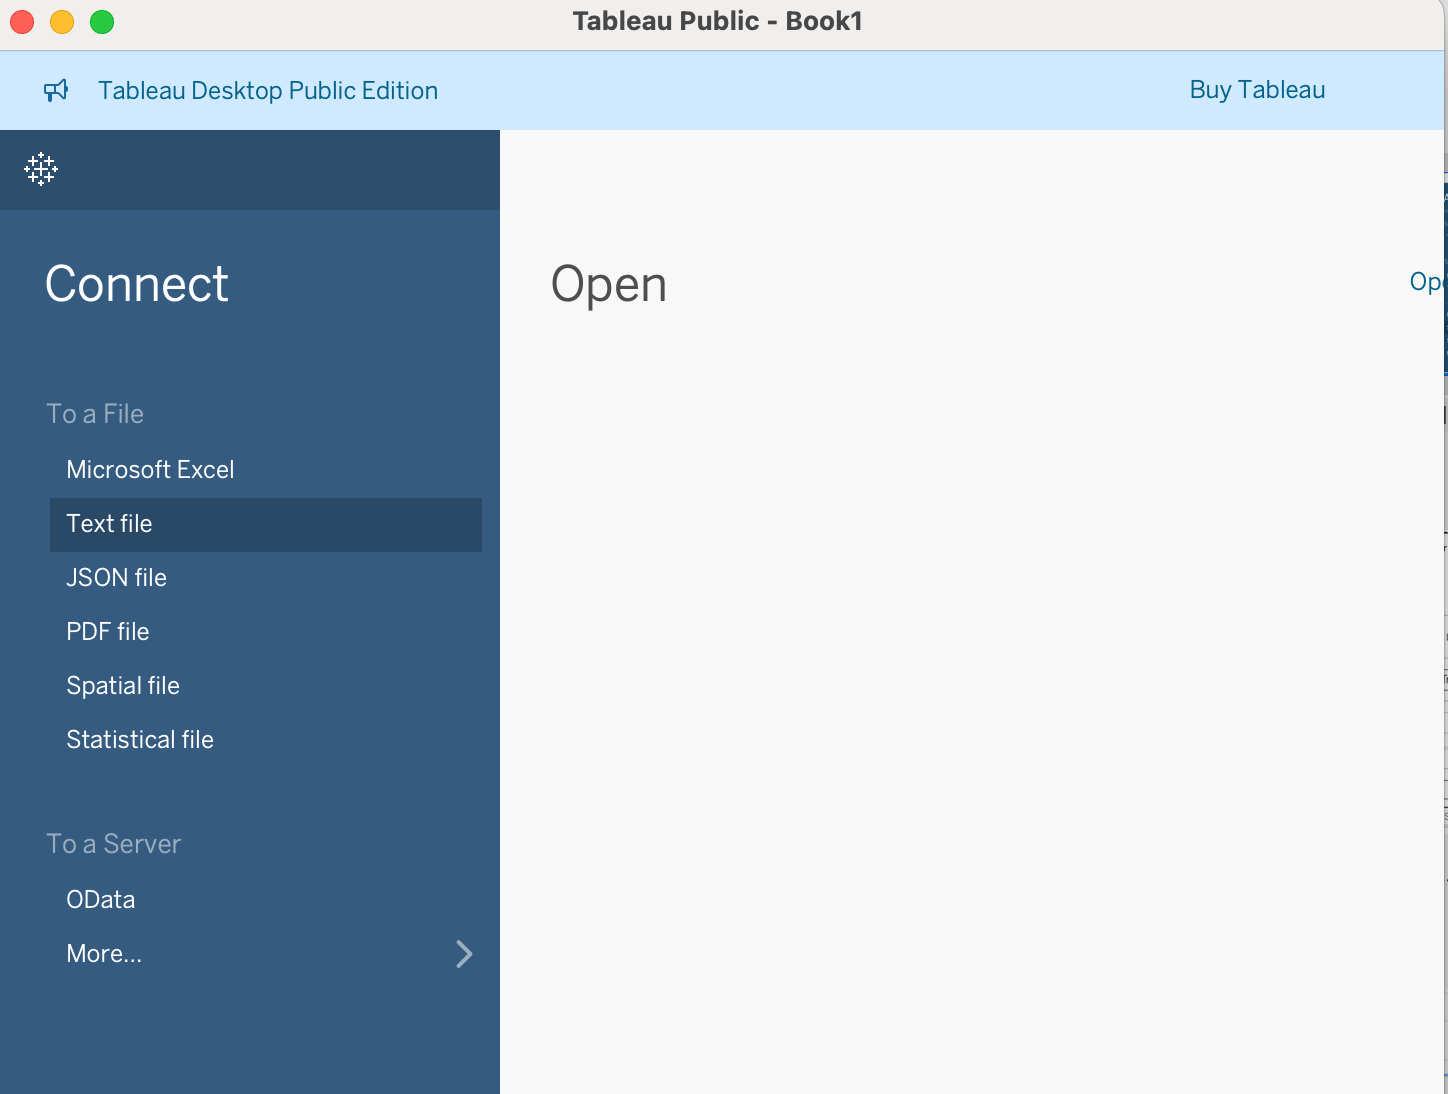
- Browse to your downloaded CSV file and select it.
- Tableau will show a preview of the data. Click Sheet 1 to begin working.
- Tableau helps you explore and present data using interactive visualizations.
- Tableau Public is free and great for learning, but saves work to the web.
- Tableau Desktop provides additional functionality and is free for students.
- Use well-formatted CSVs to start quickly.
Content from Exploring and Cleaning Your Data
Last updated on 2025-06-05 | Edit this page
Overview
Questions
- How does Tableau interpret and categorize data types?
- What are Dimensions and Measures?
- How do I identify and prepare fields for visualization?
Objectives
- Understand Tableau’s automatic data typing (dimensions vs. measures).
- Explore the Show Me panel to preview visualization options.
- Use calculated fields and binning to prepare data for charts.
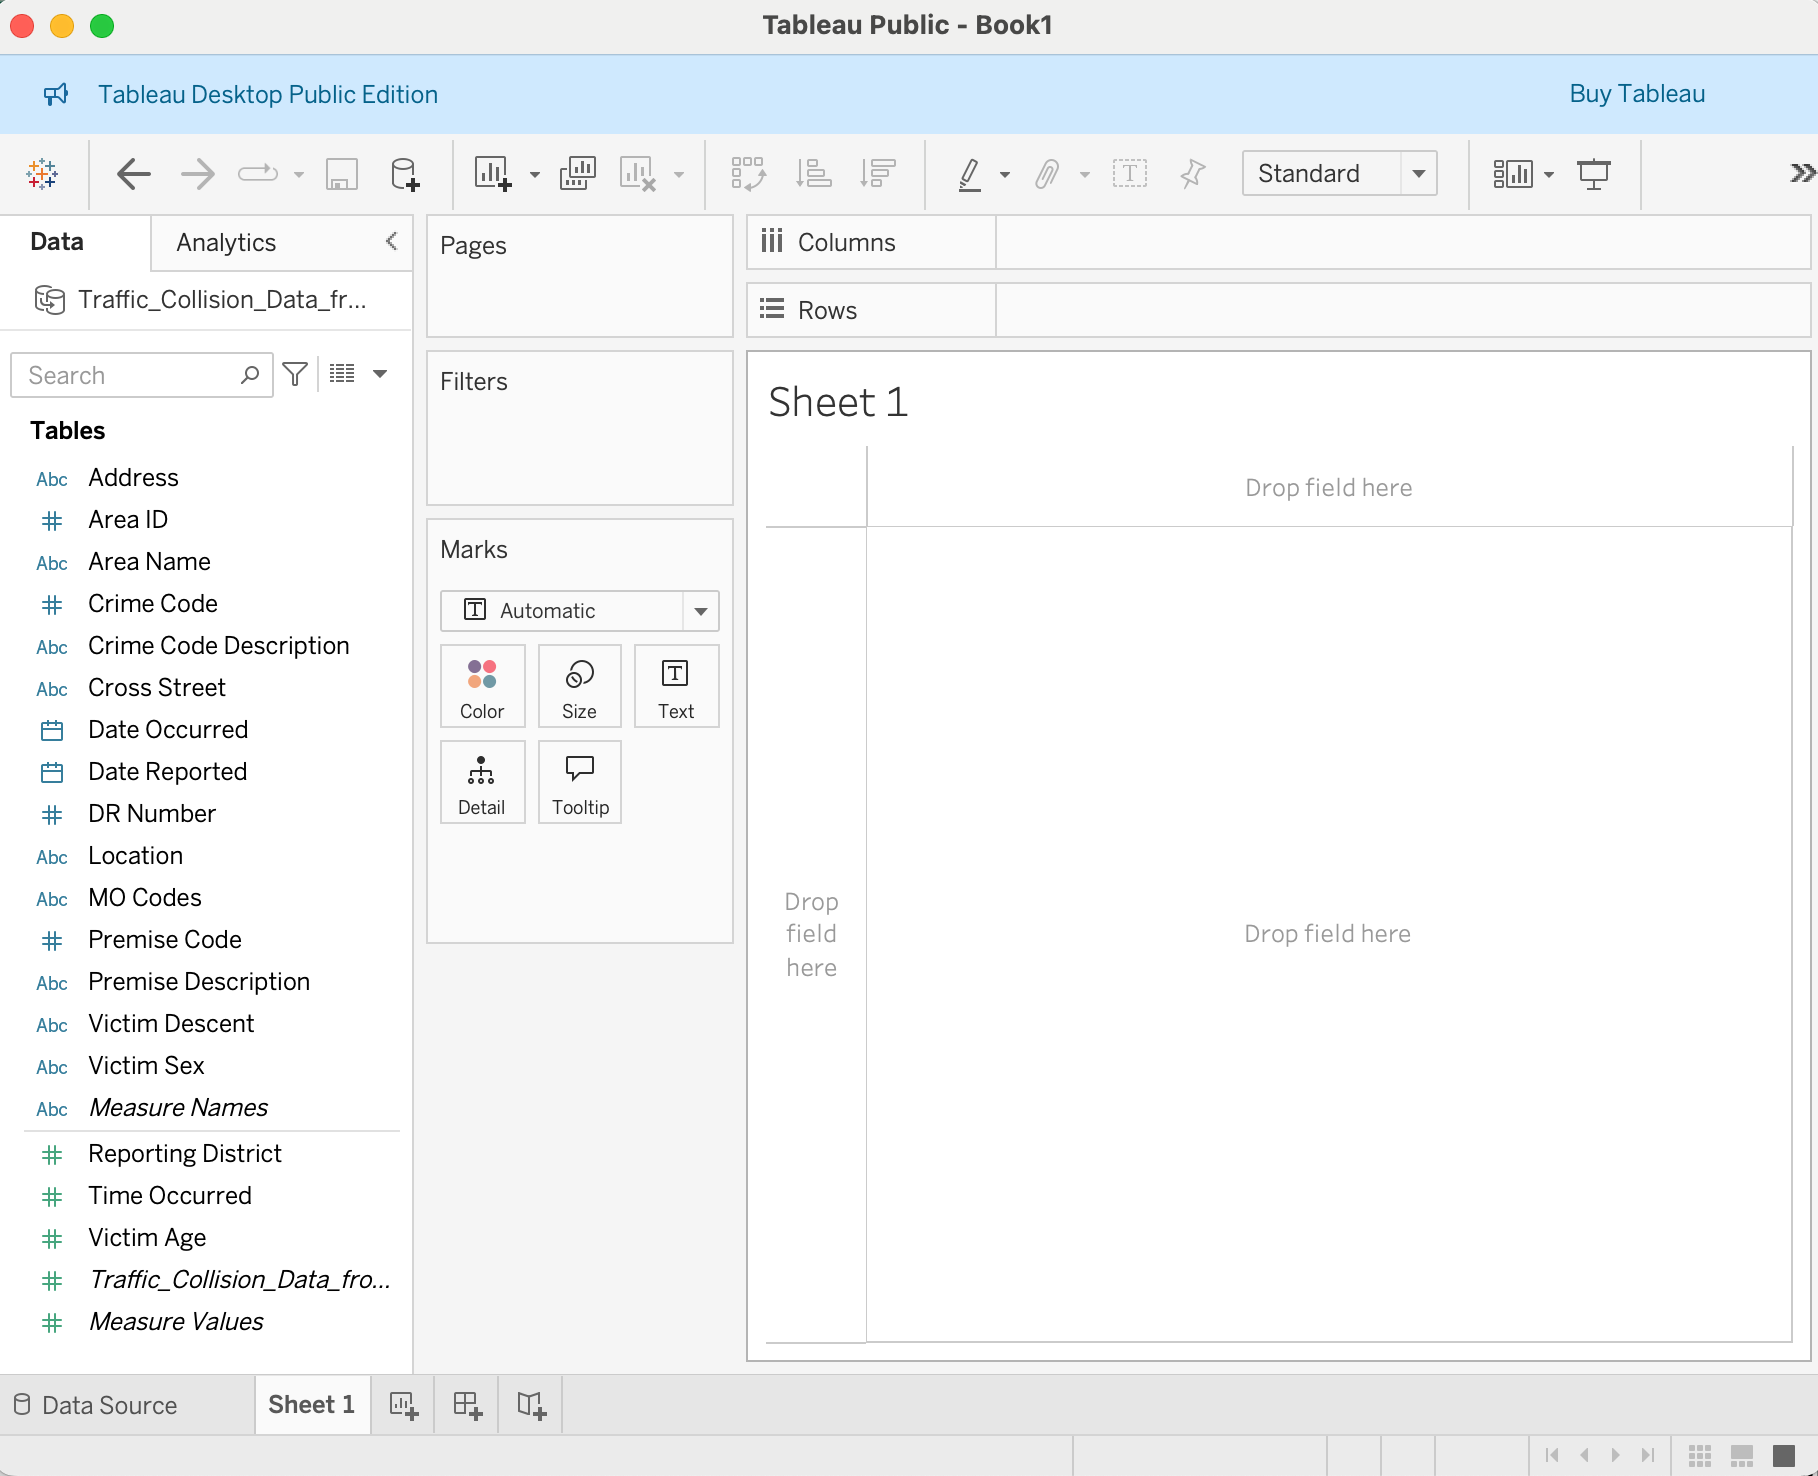
Dimensions and Measures
After loading your dataset and opening a worksheet, you’ll notice that Tableau classifies your columns as either:
- Dimensions (blue): qualitative data like names, IDs, or categories.
- Measures (green): quantitative data that can be aggregated, such as counts or amounts.
Tip:
You can change a field’s classification by right-clicking and selecting Convert to Dimension or Convert to Measure.
Discrete vs. Continuous
Tableau also distinguishes between:
- Discrete fields: Separate values like city names, months, or categories. These usually appear as blue pills.
- Continuous fields: Numeric or time-based fields used on a continuous scale. These usually appear as green pills.
Pro-Tip: Blue vs. Green
In Tableau, colors are key! - Blue pills (discrete) mean you’re looking at distinct categories or individual items. - Green pills (continuous) mean you’re viewing data along a continuous axis, like a range of numbers or a timeline.
Sometimes, Tableau might interpret a date field as discrete (blue), showing individual years as distinct categories. However, for analyzing trends over time, we often prefer a continuous (green) date field so it acts like a proper time axis. You’ll see us change this later to ensure smooth visualizations.
Exploring the Data with Show Me
The Show Me panel suggests visualizations based on the fields you’ve selected.
Try this:
- Select
Area NameandDR Number - Click on different chart types in the Show Me panel
- See how Tableau updates the chart preview dynamically
Creating a Calculated Field
You can create new fields to better control your visualizations. A calculated field allows you to perform calculations or transformations on existing data to create new insights.
To count the number of traffic accidents:
- Right-click in the Data pane → Create Calculated Field
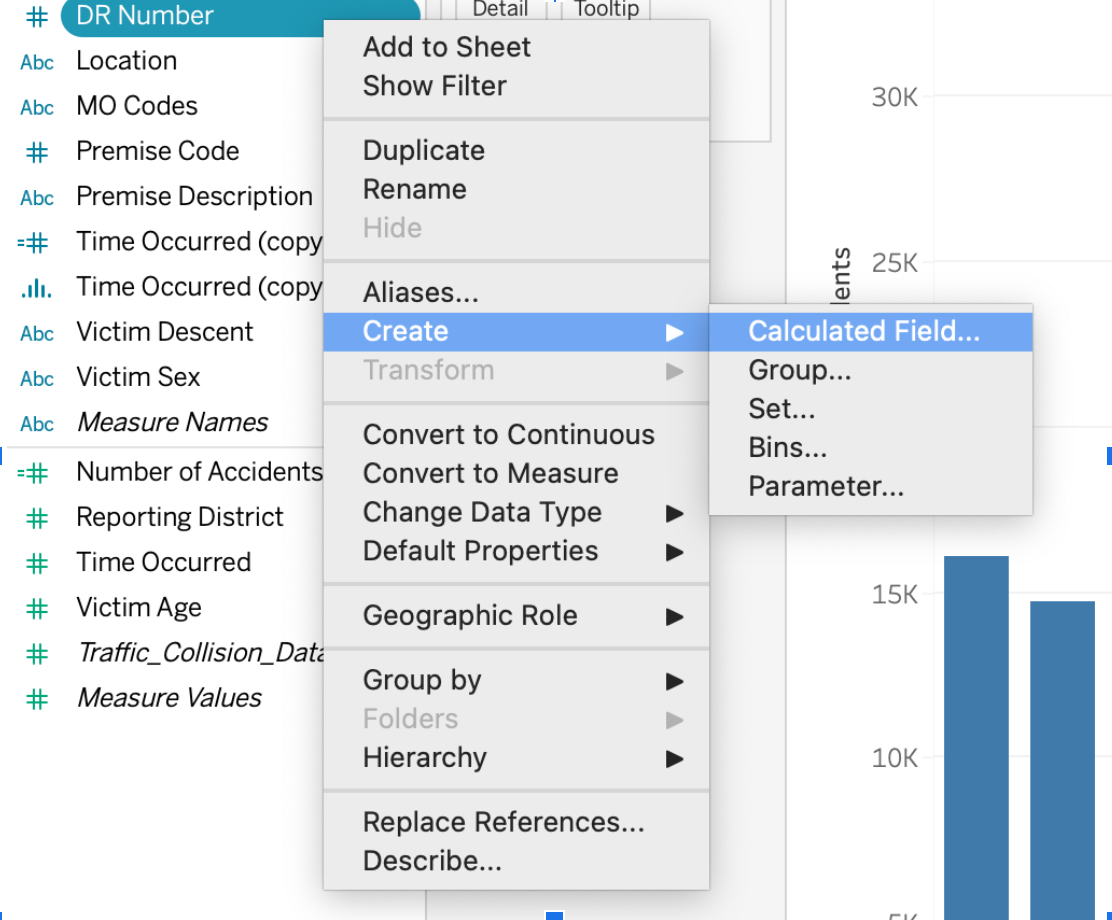
- Name it:
Number of Accidents - Formula:
COUNT([DR Number])
This new measure will appear in your data pane. You might notice it’s
a green with a little = sign next to it.
Can you guess why Tableau interprets Number of Accidents as
a continuous measure? (Pause for thought) It’s
green because it’s quantitative (a number of accidents), and it’s a
measure because it’s an aggregated count.
Troubleshooting Tip: Freezing Tableau
If Tableau freezes while you’re working, it can be frustrating! Try saving frequently. Also, a good practice before experimenting with complex changes is to duplicate worksheets. To duplicate: right-click on the sheet tab → Duplicate. This ensures you have a stable version to revert to.
Creating Bins (for Time of Day)
To examine accident frequency across different times of day, creating bins allows you to group continuous data into discrete intervals. This is particularly useful for building histograms or charts that show distributions.
- Right-click on
Time Occurred→ Duplicate - Right-click the duplicate → Convert to Dimension (This is important because we want to treat hours as distinct categories for grouping, not a continuous stream.)
- Right-click again → Create Bins
- Set bin size to
100(This effectively groups by hour, asTime Occurredmight be in a HHMM format.)
This creates a new field like Time Occurred (bin) that
groups records by hour.
Practicing with Tableau
- Use Show Me to try 3 different chart types with
Area Name,Date Occurred, andDR Number. - Create a calculated field to count accidents.
- Create a binned version of
Time Occurred. - Which fields would be good candidates for filters in a dashboard?
Data Exploration & Preparation
Think about what each field represents and how it might be grouped or summarized. Clean, consistent values (like standardized department names) make visualizations more readable and accurate. Remember, the goal of cleaning and exploring data is to make it ready for clear, effective communication through visualizations.
- Tableau automatically classifies data into dimensions (categorical) and measures (quantitative).
- The “Show Me” panel suggests visualization types based on selected data.
- Data preparation, including binning and calculated fields, improves visualization clarity.
Content from Visualizing Data with Charts and Maps
Last updated on 2025-06-05 | Edit this page
Overview
Questions
- How do I create a line chart, histogram, or map in Tableau?
- How do field types affect the kind of visualization Tableau creates?
- How can I use geographic data for mapping?
Objectives
- Create a line chart showing accidents over time by area.
- Use binned time data to generate a histogram.
- Create a basic map using latitude and longitude values.
Welcome back! In this episode, we will take the data we’ve prepared and start building impactful visualizations. We’ll explore how to create common chart types, such as line charts and histograms, and delve into the exciting world of mapping with geographic data.
Line Chart: Accidents Over Time by Area
To start, let’s visualize how the number of accidents changes over time, broken down by different areas. When thinking about a “time series” chart, we typically want time on our horizontal (x) axis. Let’s examine our available time variables.
Accidents over time
- Open a new worksheet. Let’s rename this sheet
Accidents Over Time. - Drag
Date Occurredto Columns. You’ll notice it likely appears as a blue pill (discrete year). -
Important: Right-click
Date Occurredon the Columns shelf → Convert to Continuous (chooseYearunder the green “Continuous” section). This transforms it into a green pill, representing a continuous timeline. - Drag your calculated field,
Number of Accidents, to Rows. - To see trends for different areas, drag
Area Nameto Color under the Marks card. This will create a separate line for each area and generate a color legend. - Double-click axis labels to rename them if desired, for example, from “SUM(Number of Accidents)” to “Number of Accidents.”
Understanding Continuous vs. Discrete Dates
When you first drag a date field, Tableau often defaults to a “blue pill” (discrete), showing individual years as distinct categories. However, for visualizing trends over time along a continuous axis, a “green pill” (continuous) is essential. This creates a proper timeline, allowing for smooth lines and animations, which we’ll explore later!
Histogram: Accidents by Time of Day
Use the binned field created in the previous episode to examine accident frequency over time.
- Create a new worksheet.
- Drag
Time Occurred (bin)to Columns. - Drag the calculated field
Number of Accidentsto Rows.
- Optional: Drag
Area Nameto Filters, then click the filter card menu → Show Filter.
Histograms are ideal for showing the distribution of values across intervals—perfect for analyzing “Time Occurred.”
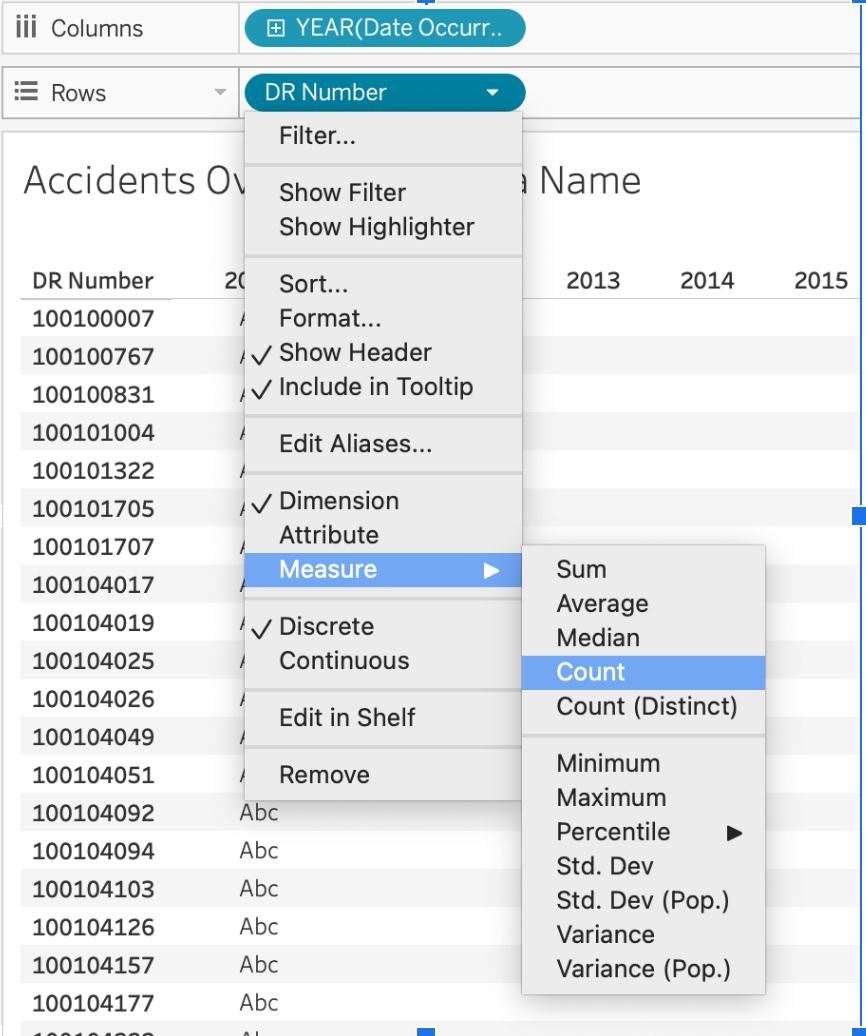
Bar Chart: Accidents by Age
Next, let’s visualize how accident counts vary by the age of the victim. This will help us understand the distribution of accidents across different age groups.
Accidents by Age
- Create a new worksheet and rename it
Age Distribution of Accidents. - Drag
Victim Ageto Columns. - Right-click on
Victim Ageon the Columns shelf and choose Convert to Dimension. (Even though age is a number, we’re treating it as a distinct category for each bar in this chart, rather than a continuous range for a single line.) - Drag
Number of Accidents(your calculated field) to Rows. - Change the Marks type from Automatic to Bar.
- Use the Size slider on the Marks card to reduce bar width and prevent overlap, making the bars easier to distinguish.
- Go to Analysis > Show Mark Labels to display the
Number of Accidentsdirectly on top of each bar.
Interpreting the Age Distribution
Now, let’s look at this distribution. Notice any interesting patterns? You might observe peaks at specific ages (like 30, 35, 40, 45). This has come up before in workshops, and it’s quite interesting! It often makes us wonder if, for example, the LAPD estimates or rounds ages to the nearest five-year mark when exact victim age is unknown.
Also, look at the very high bar around age 99. Why might there be so many victims listed at age 99? While we don’t have explicit documentation, a common practice in data collection is to use “99” as a placeholder for an unknown age. This is a great example of how visualizing data can reveal unexpected trends and prompt deeper questions about data collection practices!
Interpret the Distribution
- Do any ages have unusual spikes?
- What might cause them?
Consider estimation or rounding practices in field data collection.
Map: Plotting Accidents in Los Angeles
Now for one of Tableau’s most powerful features: creating maps! If
your dataset includes a Location column like
"34.05, -118.24", Tableau can help you visualize these
geographic points.
Mapping Accidents in Los Angeles
- Open a new worksheet and rename it
Accident Map. Right-clickLocation→ Split. This will separate the latitude and longitude values based on the comma. - Rename the resulting fields
Location Split 1toLatitudeandLocation Split 2toLongitude. - Right-click each field in the Data pane → set Data Type to Number (decimal).
- Right-click again → set Geographic Role: for your
Latitudefield, chooseLatitude; for yourLongitudefield, chooseLongitude. (You’ll see a small globe icon next to them once set correctly.) - Double-click both
LatitudeandLongitudefields. Tableau will automatically place them on the Rows and Columns shelves, respectively, and start rendering a map. - Once the map begins to load, use the map search bar (magnifying glass icon in the top right of the map view) to zoom directly to Los Angeles.
Map Loading & Interaction Tips
Maps, especially with many data points, can sometimes take a moment to load. Be patient! Once loaded, you might find yourself zoomed out to a global view. Use the search bar to pinpoint “Los Angeles, California” and quickly zoom in.
Each point now represents a traffic incident. You can click the Pan Tool (represented by a hand icon) on the map controls to navigate the map view easily.
Each point now represents a traffic incident.
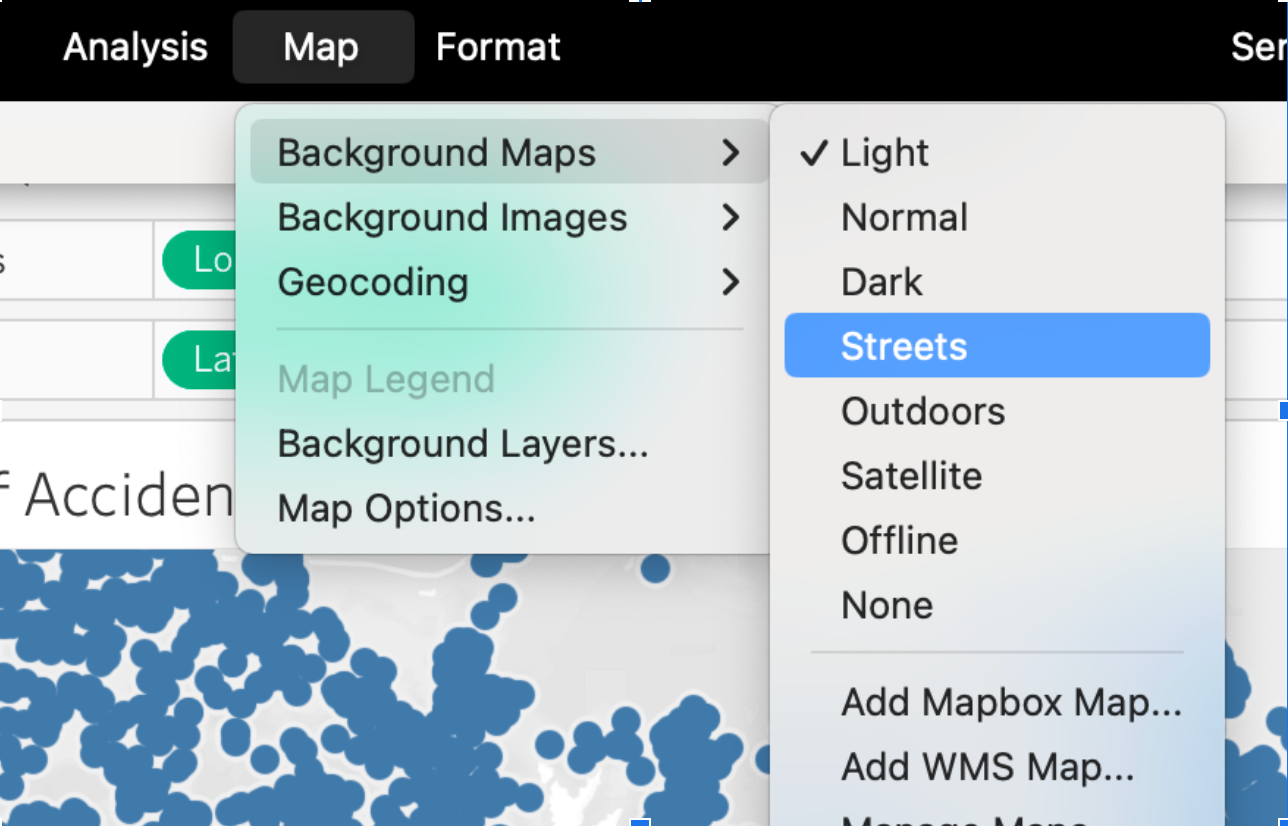
Optional: Refine Your Map Display
To improve readability and orientation:
- Go to Map → Background Maps → Streets to switch to a street-level basemap.
- Use the Pan Tool (click the hand icon) to move across the map.
- Remove null points by right-clicking on any point in the ocean (0,0) and selecting Exclude.
Challenge
Challenge: Compare Accidents Across Areas
Create a bar chart showing how accident counts compare across different police areas.
- Which field will you put on the x-axis (Columns)?
- Which field is best for the y-axis (Rows)?
- Can you improve the chart by adding
Color,Label, or aFilter?
Use Area Name for Columns and
Number of Accidents as the Measure.
- Drag
Area Nameto Columns. - Use
Number of Accidents(COUNT ofDR Number) on Rows. - Optionally add
Number of Accidentsto Label for better readability.
- Dragging fields to Columns and Rows defines the structure of your chart.
- The Show Me panel helps you quickly preview different visualization types.
- Latitude and longitude values can be transformed into map views using geographic roles.
Content from Adding Interactivity with Pages and Filters
Last updated on 2025-06-12 | Edit this page
Overview
Questions
- How can I animate a visualization over time?
- How can filters help explore different aspects of a dataset?
- What options in Tableau help make visualizations more dynamic and readable?
Objectives
- Use the Pages shelf to animate a chart over time.
- Apply filters to limit and explore subsets of your data.
- Improve visualization clarity with labels, tooltips, and color.
In this episode, we’ll transform our static visualizations into dynamic, interactive tools. We’ll explore how to animate charts to reveal trends over time and how to empower users to examine specific subsets of your data using filters.
Animation Using the Pages Shelf
We can animate our line chart to show how accidents accumulate over time. To do this without altering your original chart, it’s a good practice to duplicate the existing worksheet.
- Duplicate your line chart worksheet (Right-click on the sheet tab > Duplicate).
- Drag
Date Occurredto the Pages shelf. This creates a control panel for animation. - Change the Marks type from
AutomatictoCirclefor better visibility of individual data points as they move. - In the Pages card:
- Click Show History.
- Set Marks to show history for All, and enable Trails. (Choosing ‘Trails’ creates a nice line indicating the past path, with the circle marking the current point in time. ‘Both’ would show individual circles at every past point, which can get cluttered.)
- Click the Play button in the Pages card to animate the content. Be patient, as rendering can sometimes take a moment, depending on your computer’s performance and the size of the data.
The Pages Shelf: Your Animation Control
The Pages shelf enables you to break your visualizations into “frames” based on the values of a field, making it perfect for time-based animations. As the animation plays, you might observe lines “zigzagging” or crossing. This indicates that an area’s relative ranking in accident counts might change over time.
Interpreting Your Animated Chart
As your chart animates, observe the evolving trends: * Notice how lines grow and diverge over the years. * Can you identify which areas consistently show higher accident counts? * Do some areas, like 77th Street, visibly “take the lead” in cumulative accidents compared to others like Foothill?
This dynamic view helps reveal long-term patterns that a static chart might not.
Using Filters to Refine Visuals
Filters empower users to explore specific subsets of your data directly within the visualization. This is a fundamental step in making your charts more interactive and user-driven.
- Drag a field like
Area Nameto the Filters shelf. - In the filter dialog box, select the specific values you wish to include, then click “OK”.
- Now, right-click on the
Area Namefilter on the Filters shelf and select Show Filter from the dropdown menu. - Tableau adds a filter widget to your view, typically on the right sidebar. Users can now control which data is displayed dynamically.
Using Filters in Tableau
You can change the filter style (e.g., to a dropdown, checklist, or slider) by clicking the small dropdown arrow in the top right of the filter widget in your view.
Filters are powerful, especially when building interactive dashboards. In the next episode, we’ll see how filters on one sheet can be used to control all visualizations on a dashboard, creating a truly unified experience.
Improving Readability
Small changes improve how users read and interpret your visualization:
- Drag a field to Label** to annotate points or bars
- Use Color to differentiate categories
- Hover to preview tooltips and ensure they communicate clearly
- Use Title and Axis Labels to explain your chart
Challenge
Challenge: Filter and Customize a Histogram
Using your histogram of Time Occurred (bin), add a
filter to let users explore different Area Name values.
- Can you make the title dynamic?
- Can you adjust the filter appearance for better UX?
Double-click the title → Insert → select the filter field name.
- Drag
Area Nameto Filters → click Show Filter. - Change filter style via dropdown menu.
- Double-click the chart title → Insert →
Area Name.
- The Pages shelf adds animation by slicing your visualization into steps.
- Filters let you focus on specific parts of your dataset.
- Labels, color, and dynamic titles help clarify what your visualization is showing.
Content from Building and Sharing Dashboards
Last updated on 2025-06-04 | Edit this page
Overview
Questions
- How do I combine multiple visualizations into a single dashboard?
- How can filters and interactivity be shared across charts?
- How do I publish or share Tableau Public visualizations?
Objectives
- Create a dashboard that brings together multiple views.
- Enable filtering across all visualizations in a dashboard.
- Save and share your dashboard using Tableau Public.
Welcome to the final episode! Here, we’ll bring together all the visualizations we’ve created into powerful, interactive dashboards. Dashboards are where your data story truly comes alive, allowing others to explore and understand your insights.
What Is a Dashboard?
A dashboard in Tableau is a canvas where you can combine multiple charts and visual elements into a single interactive view. This allows users to compare different perspectives and present a lot more information in a smaller, cohesive frame.
Creating a Dashboard
- Click the Dashboard icon (the middle tab at the bottom, typically between “New Worksheet” and “New Story”).
- In the left sidebar, you’ll see a list of all your created sheets.
Drag your desired sheets (e.g.,
Accidents Over Time (Animated),Running Total Accidents Over Time, andAccident Map) into the main dashboard area. - Adjust the layout by dragging edges of the sheets or by setting the dashboard size to Automatic for flexible viewing.
- You can label your sheets directly on the dashboard by double-clicking the tab name at the bottom of each sheet you’ve added.
Adding Interactivity
This is where dashboards become truly powerful! You can make any sheet on your dashboard act as a filter for others, allowing users to interact with your data dynamically.
Adding an Interactive Filter
- Click on a chart inside the dashboard that you want to use
as a filter (e.g., your
Accident Map). - On the floating toolbar that appears when a chart is selected, click the Use as Filter icon (it looks like a funnel symbol).
- Repeat this step for any other views that should affect others
interactively. For example, if you make your
Accidents Over Time (Animated)sheet a filter as well.
Now, when you click a specific value (e.g., a bar on a chart, or a specific area on a map), other views linked by the filter will respond instantly, updating to show only the data relevant to your selection. This dynamic interaction makes your dashboard a powerful exploration tool!
Saving and Publishing to Tableau Public
Once you’re satisfied with your dashboard:
- Go to File > Save to Tableau Public As…
- Log in to your Tableau Public account.
- Name your workbook and save it.
- Tableau will open a browser with your published visualization.
- Click the Share icon to get an embed code or link.
All data in Tableau Public is public. Don’t upload sensitive or private data.
Challenge
Challenge: Build and Publish a Dashboard
Create a dashboard with at least two visualizations. Enable filter interactivity, and publish it to your Tableau Public profile.
- What story does your dashboard tell?
- Could someone unfamiliar with the data understand what they’re seeing?
Add meaningful titles and tooltips to help interpret your charts.
- Combine the Line Chart and Map into one dashboard.
- Use
Area Nameas a filter. - Add a dynamic title and test your dashboard in the browser.
- Dashboards combine multiple charts into one interactive view.
- Filters and selections can link multiple charts together.
- Tableau Public lets you publish and share dashboards easily.